
Measure readership and assistant performance
Use Insights to filter analytics by time range and project, compare periods, export CSV data, and review Ask AI conversations.
Use Insights to see how readers use your published documentation, how well the Ask AI assistant answers them, and how much support work your docs prevent. This guide shows you how to choose a time range and project, compare periods, export the data, and review individual assistant conversations.
Before you begin
- Access: Sign in to Doxbrix and belong to a workspace. Insights shows data for the projects you can access in that workspace.
- Published content: Metrics fill in only after readers visit a published site. See Publish and edit published pages.
- Assistant data: The assistant sections and Conversations need Ask AI turned on for the site. See Set up the Ask AI assistant.
What your plan includes
Every plan can open Insights, change the range and project, and turn on Compare. Two features depend on the plan:
| Feature | Free and Starter | Pro | Business |
|---|---|---|---|
| Analytics tier | Basic | Advanced | Advanced with export |
| Export to CSV | Not available | Not available | Available |
| Docs gaps section | Upgrade notice | Upgrade notice | Available |
For every plan limit, see Plans and limits reference.
Sections in Insights
The Explore insights list on the left links to 11 sections. Select a section name to jump to it, and select Back to top to return to the toolbar.
| Section | What it measures |
|---|---|
| Content performance | Total docs, Avg read time, Completion rate, Views over time, Top performing pages and Top entry pages |
| Assistant activity | Total conversations, Containment rate, Handoff rate, Avg messages / conv, the Reader funnel, Top intents and Usage by surface |
| Search behavior | Total searches, Search success rate, Zero-result queries and Top search terms |
| Reader engagement | Unique readers, Returning readers, Bounce rate, Session depth, Device split and Top geographies |
| Team adoption | Active contributors, published edits, collaboration activity and review turnaround |
| Sentiment & responses | Positive, Neutral and Negative feedback, Most mentioned topics and Top unresolved pain points |
| Link health | Broken links, Redirected links, Link health score and Pages with the most issues |
| Missing pages | 404 visits, Impacted users, Missing rate, Top missing URLs and Suggested redirects |
| Support impact | Tickets avoided, Deflection rate, Est. hours saved, Est. cost saved and Top deflecting pages |
| Support tickets | Tickets created, Via AI assistant, Open or pending, CSAT on resolved and Pages that generate tickets |
| Docs gaps | Clusters of reader questions your docs do not answer yet |
Containment rate is the share of assistant conversations that the assistant resolved without handing the reader to support. Handoff rate is the share it passed to a person. Est. hours saved and Est. cost saved multiply the tickets avoided by an hourly support cost and an average number of minutes per ticket; the section shows the values it used, for example Calc based on $40/hr × 15 min per ticket.
Explore your analytics
In the left sidebar, select Analytics. The Insights page opens at /analytics on the 30d range for All projects.
The toolbar holds the range buttons 7d, 30d, 90d and All time, the Project filter list, Compare and Export. The first section, Content performance, shows the range it covers, such as Last 30 days.
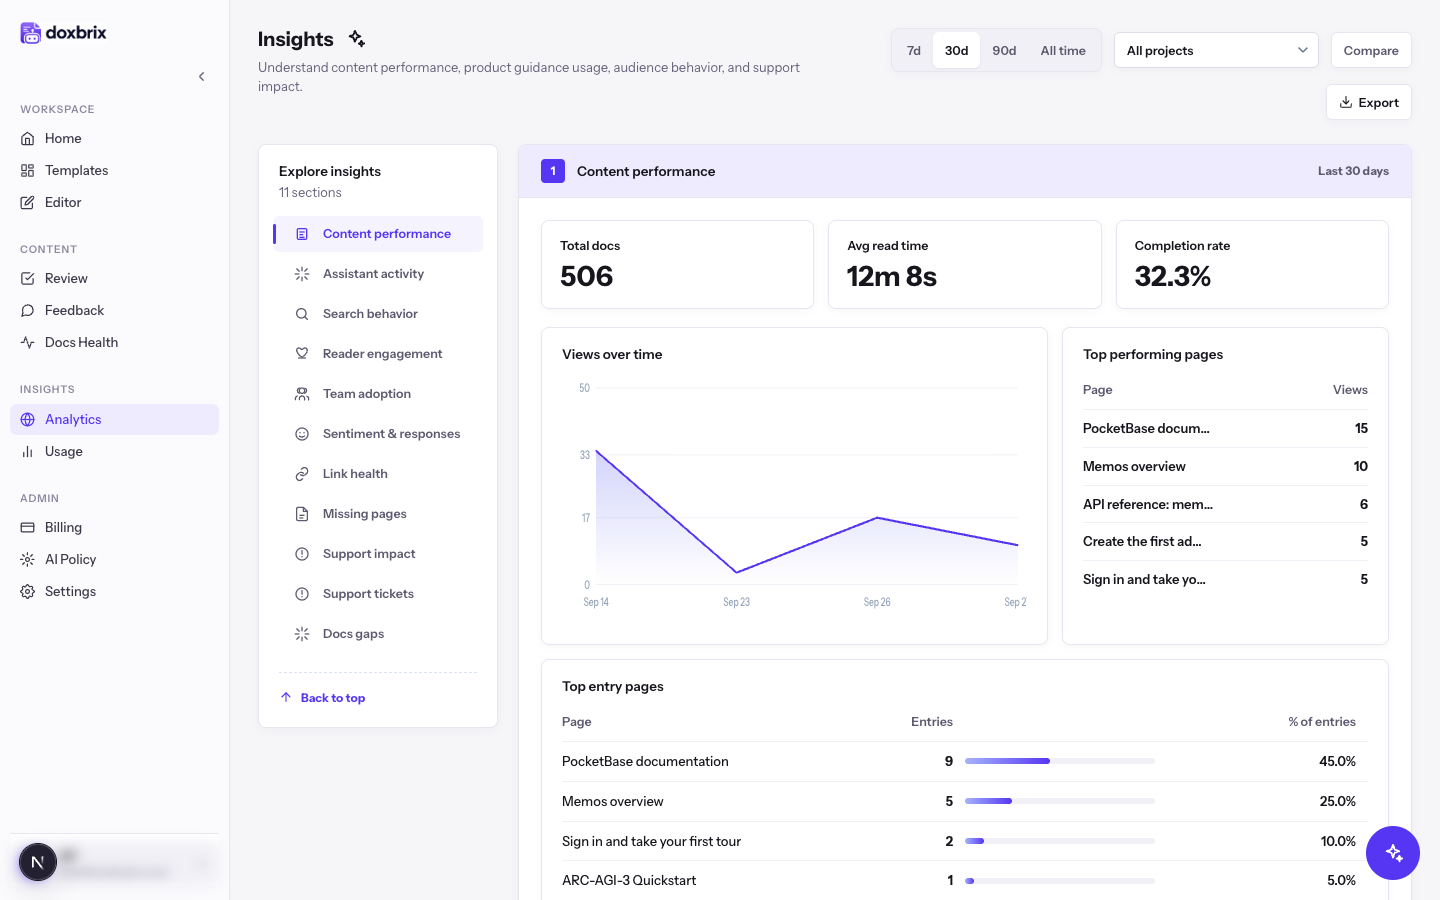
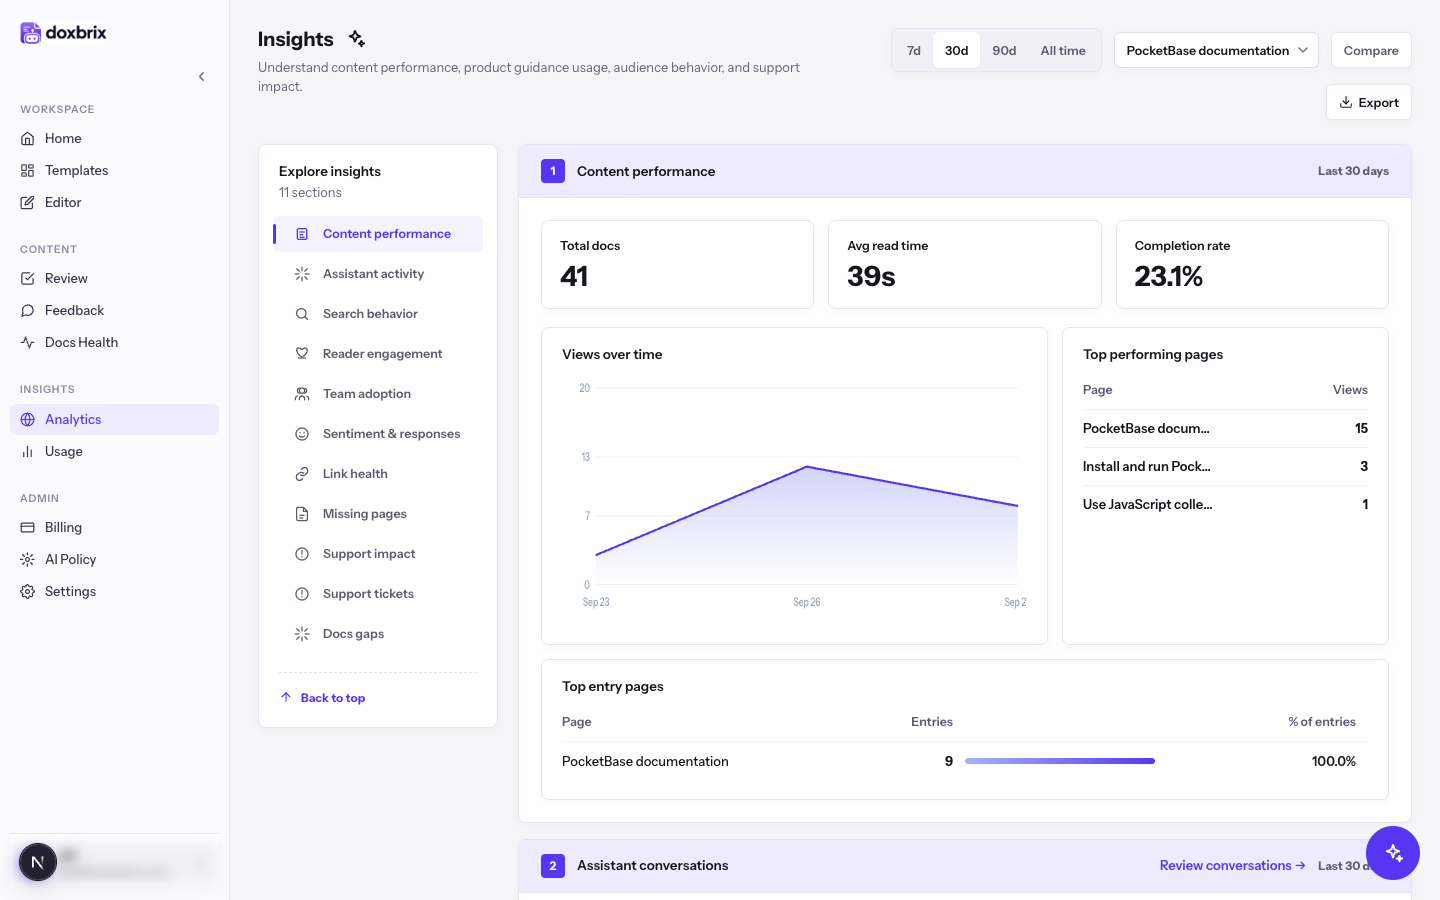
Open the Project filter list and choose a project, for example PocketBase documentation. Every section reloads with data for that project only. In this example, Total docs drops from the workspace total to the 41 pages in that project.
To see the whole workspace again, choose All projects.
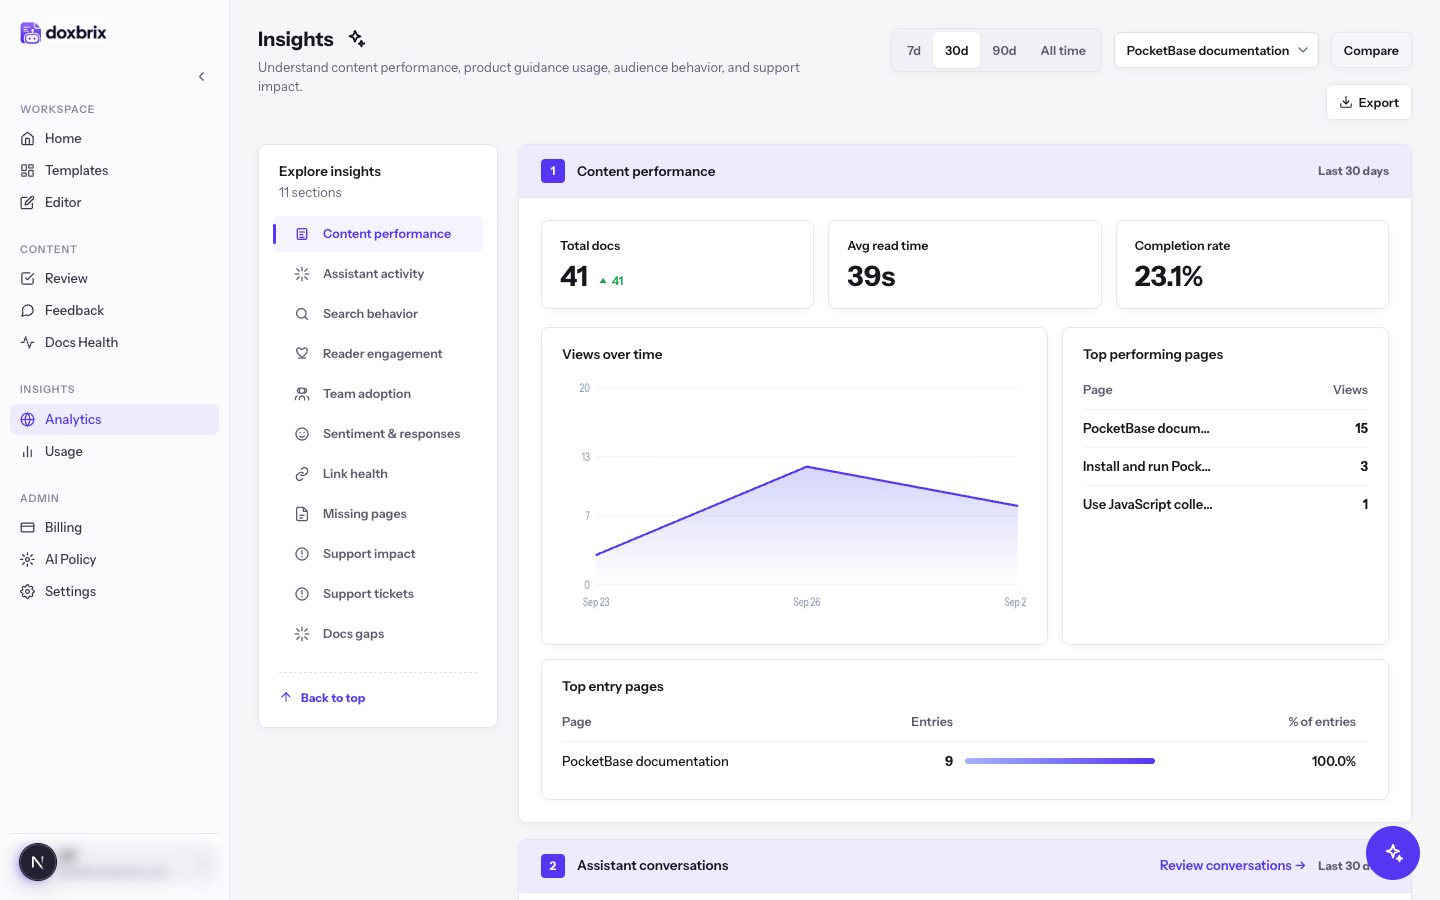
Select Compare. Metric tiles now show a change indicator beside each value that compares the selected range with the period of the same length before it. A green upward arrow means the value rose.
Select Compare again to hide the change indicators.
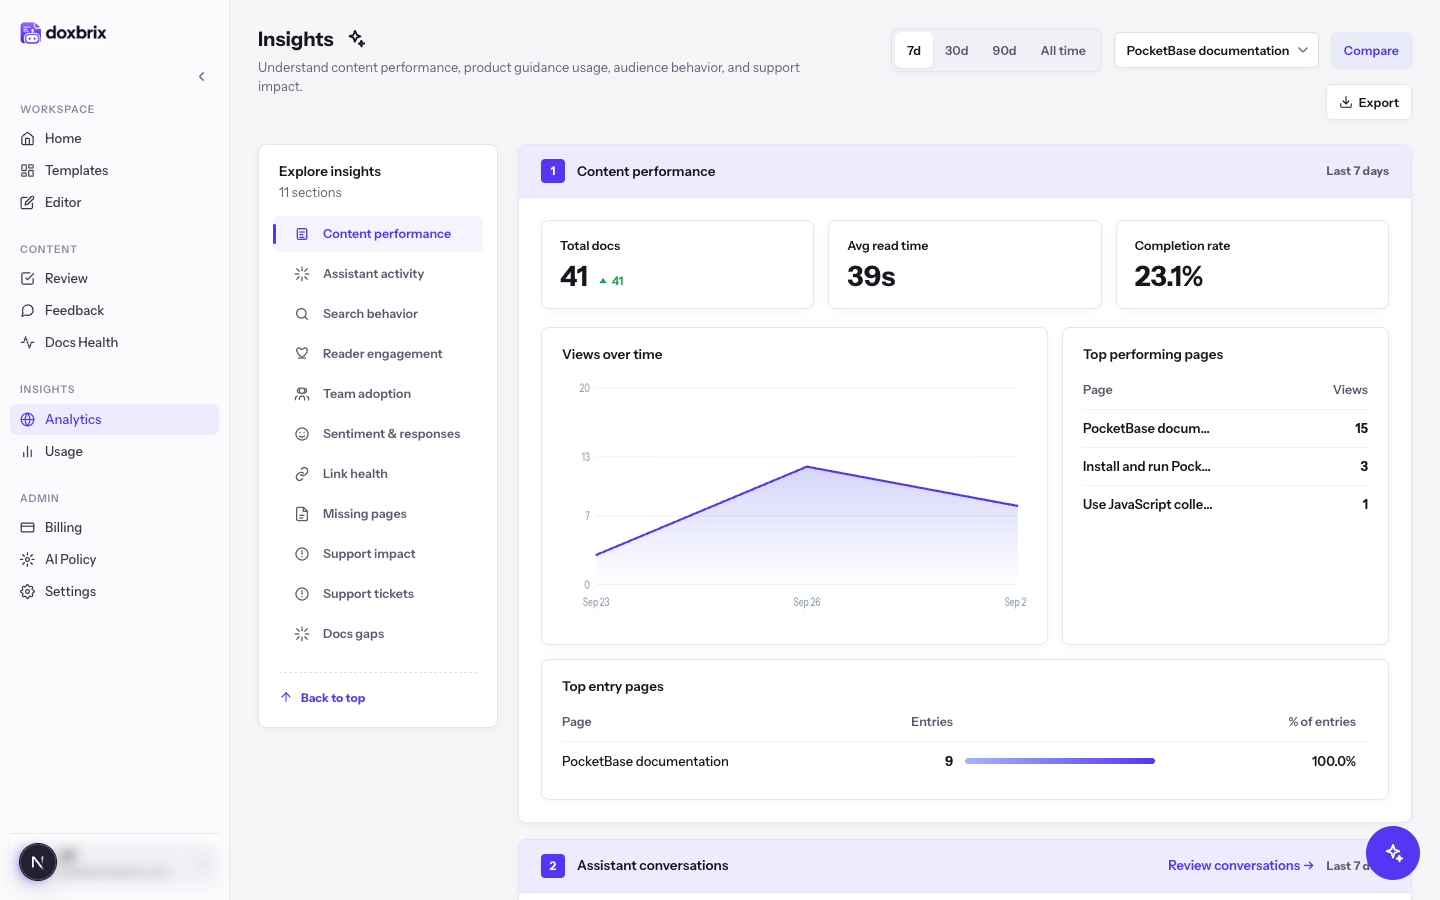
Select 7d to show the last seven days. Section headings update to Last 7 days, and your project filter and Compare setting stay in place. Select 90d for the last quarter or All time for every recorded event.
The range, project and compare choices are saved in the page address (for example, /analytics?range=7&compare=1), so you can bookmark a view or share it with a teammate.
On the Business plan, select Export to download every section as one CSV file. The file is named after the range and project, for example insights-30-<projectId>.csv, and each row lists the section, the table, the item and its value.
On other plans, Export is unavailable and its tooltip reads CSV export is available on the Business plan. Upgrade to enable exports. See Manage billing and change plans.
In the Assistant conversations section, select Review conversations →. The Conversations page opens at /analytics/conversations and lists recent questions readers asked the assistant.
Filter the list with these controls:
- All turns or Needs attention. Needs attention shows turns with a Not helpful vote, a No answer, Low confidence or Error result, or a question the reader had to rephrase.
- The range buttons 7d, 30d, 90d and All time.
- Project, Surface (Web widget, Docs sidebar, Help center, Mobile or Connected site) and Vote (Any vote, 👍 Helpful or 👎 Not helpful).
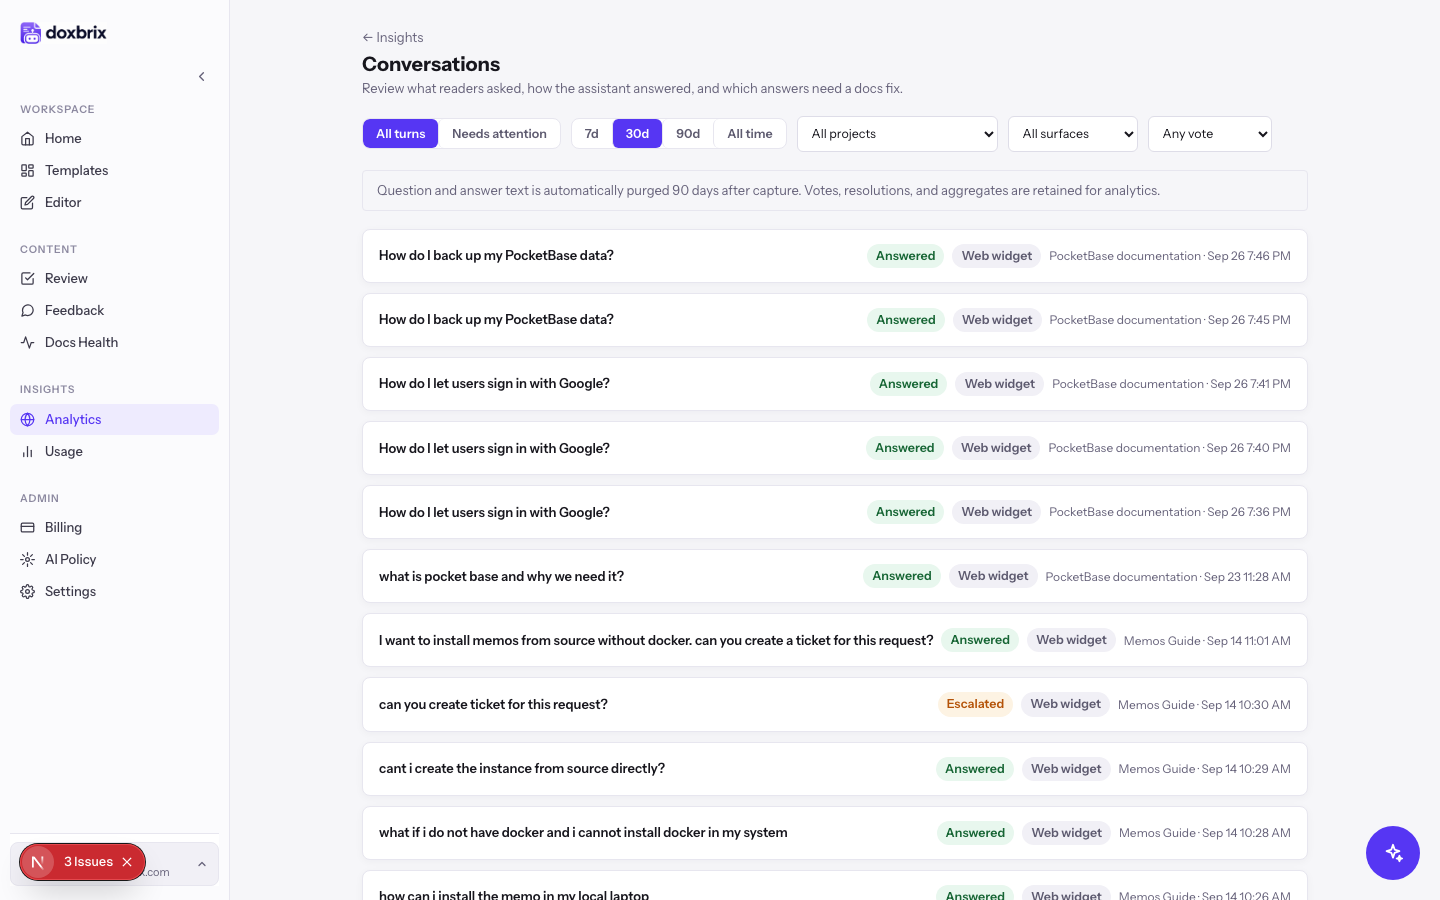
Select a question to expand it. The card shows the result badge (such as Answered or Ticket drafted), the reader's vote and surface, the answer text, any Reader comment, the Cited pages, the confidence score, and the number of citation and follow-up clicks.
When an answer is wrong or incomplete, open the cited page in the editor and fix it, or add the missing page. Select ← Insights to return to the dashboard.
Verify
- The selected range button and the Project filter value match the view you wanted, and section headings show the matching period.
- With Compare on, metric tiles show change indicators.
- On the Conversations page, the list matches your filters or shows No conversations match these filters yet.